
OBJECTIVE:
To determine the phase diagram ethanol/ toluene/ water system theory.
THE DATE OF THE EXPERIMENT:
10th November 2016
INTRODUCTION
In making pharmaceutical formulation often multiple components need to be mixed together and need to be in homogeneous form. This is usually possible by knowing the exact ratio of each component to be mixed with regard of some other condition such as temperature
In this experiment, there are three components which were Ethanol, Toluene and Water. Using the three component system, we can know the proper proportion that can be used to achieve homogeneous solutions. Water is insoluble and toluene, but as it were mixed together with ethanol, all three components can achieve homogenous solutions if proper proportion used in the three components system. But, there are some rules that had to be follow to use the three components system.
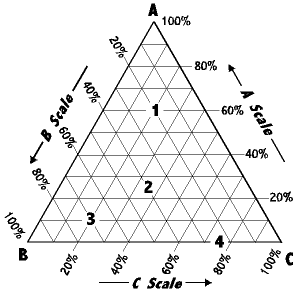
Each peak of the triangle will represent 100% of different component respectively. Each side of the triangle represents a binary mixture where two components mixed together and any line drawn parallel to one of the sides shows the percentage of a particular component. Solubility differs when there are different components mixing together. When the third component is added to a pair of miscible liquid, it may affect the mutual solubility. If the third component is more soluble in one of the liquids than in the other, then the miscibility between that pair of liquids decreases. But, if the third component is soluble in both components, then the mutual solubility will increase.
In this system, there are 3 components but only 1 phase exists. Thus, by using the phase rule, we can find out that the degree of freedom is 4 which are temperature, pressure, and concentrations of the two of the three components.
CHEMICALS:
Ethanol toluene distilled water


APPARATUS:
Conical flask retort stand and clamp dropper measuring cylinder


Burette
PROCEDURE:
Part A
- Mixtures of ethanol and toluene are prepared in sealed containers measuring 100cm3 containing the following percentages of ethanol (in percentage): 10, 25, 35, 50, 65, 75 and 90.
- 20ml of each mixture is prepared by filling a certain volume using a burette (accurately).
- Each mixture is titrated with water until cloudiness is observed due to the existence of a second phase.
- A little of water is added and shaken well after each addition. Room temperature is measured.
- The volume of the water used is recorded.
- Steps 1-6 are repeated to do a second titration. The volume of water required for complete titration of each mixture is recorded.
- Average volume of water used is calculated.
- The percentage based on the volume of each component when a second phase starts to appear or separate is calculated.
- The points are plotted onto a triangular paper to give a triple phase diagram at the recorded temperature.
- A few more measurements are done if necessary.
RESULTS AND CALCULATIONS:
| Test tube | % Ethanol (v/v) | Total volume
(average v + 20 ml) |
Ethanol | Toluene | Water | |||
| Volume
(ml) |
Percentage volume (%) | Volume
(ml) |
Percentage
volume(%) |
Volume
(ml) |
Percentage volume (%) | |||
| A | 10 | 22.0 | 2.0 | 10 | 18.0 | 89.6 | 0.1 | 0.5 |
| B | 25 | 20.2 | 5.0 | 24.8 | 15.0 | 74.3 | 0.2 | 1.0 |
| C | 35 | 20.8 | 7.0 | 33.7 | 13.0 | 62.5 | 0.8 | 3.8 |
| D | 50 | 21.2 | 10.0 | 47.2 | 10.0 | 47.2 | 1.2 | 5.7 |
| E | 65 | 22.5 | 13.0 | 57.8 | 7.0 | 31.1 | 2.5 | 11.1 |
| F | 75 | 26.7 | 15.0 | 56.2 | 5.0 | 18.7 | 6.7 | 25.1 |
| G | 90 | 29.6 | 18.0 | 51.4 | 2.0 | 5.7 | 15 | 43 |
DISCUSSION:
From the diagram, each corner represents 100 % of ethanol, 100 % of toluene and 100 % of water while the other two components are 0 %. In this experiment, A represents ethanol, B represents toluene while C represents water. The three lines joining the corner points represent two-component mixtures of the three possible combinations of A, B and C. Thus the lines AB, BC and CA are used for two-component
Besides, the triple phase diagram showed the concentrations of the three components in the system. The curve drawn in mixtures of A and B, B and C, and C and A, respectively. By dividing each line into 100 equal units, the location of a point along the line can be directly related to the percent concentration of one component in a two-component system. As we move along BC in the direction of C, we are signifying systems of B and C containing increasing concentrations of C, and correspondingly smaller amounts of B. The area within the triangle represents all the possible combinations of A, B, and C to give three-component systems.the triangular phase diagram is normally known as binomial curve or binomial. Normally, the area bounded by the binomial curve indicates a two-phase region while the area unbound by the curve is a single-phase region
Based on the results obtained, when there is a higher percentage of ethanol compared to the percentage of toluene in the mixture, the volume of water needed to titrate the mixture until cloudiness is observed is higher. The appearance of cloudiness indicates that a two-phase system is created. This proved that the ethanol had increased the miscibility of the other two components and more water is needed to break the homogeneity. A second phase will only separate out when the proportion of water added exceed the theoretical percentage where three components are partially miscible. As for the lower percentage of ethanol compared to toluene, the volume of water needed to titrate the mixture until cloudiness is observed is lower. Having higher percentage of toluene in the mixture than ethanol, little water is needed to disrupt the homogeneity.
The region under the curve shows the presence of 2 phases that is water and toluene whereas the region above the curve boundary shows one phase of homogenous solution. The bounded region is between the binomial curve and line of water and toluene mixture. Addition of ethanol will allow the 2 phase of solution to be in one phase. But, in this experiment we separate the one phase solution into two phase by titrating the solution with water. Along the toluene-water line, which represents a binary mixture of toluene and water, the liquids are able to form a homogenous mixture as long as the first point is not exceeded.
The result obtained in this experiment is incorrect due to several errors encountered while carrying out the experiment. Parallax error may occur while taking the reading of the measuring cylinder or the burette. Next, the degree of cloudiness is not sure, the volume of water added to the solution was not accurate enough. Some water might be added throughout the experiment into the apparatus when the apparatus used is not completely dry after washing. This may result in slight dilution of the mixture. Besides the volatility of the chemicals also leads to the error. This is because the mixture of toluene and ethanol may have vaporized if it is left longer and unsealed. The inconstant room temperature in the laboratory during the experiment is one of the errors too. Room temperature is one of the significant factors that will change the graph or curve pattern and this might be the cause of incomplete binomial curve.
Precautionary steps should be taken while carrying out the experiment to reduce the possibility of error to occur. All the apparatus should Rinse before use to remove impurities as the impurities may affect the result. The eye must be perpendicular to the scale of the measuring cylinder or burette to avoid parallax error. The same observer should be assigned to determine the cloudiness of mixture in order to get a more accurate results. The mixture of toluene and ethanol should be titrated immediately to prevent vaporization or it should be sealed and consistent rate of agitation should be applied for each mixture.
CONCLUSION:
Phase diagram for ternary systems- ethanol/toluene/water system- is represented using a triangle. The real curve was determined in this experiment. From the experiment, as the number of volume of ethanol by percentage increase and number of volume of toluene by percentage decrease, the volume of water will increase. When the solution is stirred, the transition from one region to another can be observed by appearance (or disappearance) of cloudiness or turbidity in the solution. The turbidity results from scattering of light by the large number of very small “oily” droplets of the second phase that are produced when the system is stirred. Sometimes it is easier to see this when stopping the stirring briefly. The three components are mixed to give an overall system composition that falls in the 2-phase region, the system will separate into two phases, a phase rich in water and another rich in ethanol. The compositions of the phases that form are given by the intersections of a tie line with the phase boundary.
REFERENCES:
- http://pharmacistinthemaking.blogspot.my/2014/12/practical-3-phase-diagram-part-a.html
- Martin’s Physical Pharmacy and Pharmaceutical Science, Sixth Edition, Patrick J. Sinko, Wolters Kluwer, Lippincott Williams & Wilkins.
- https://www.youtube.com/watch?v=u-UML97ri2k
- A Textbook of Engineering Material and Metallurgy, First Edition, Amandeep Singh Wadhwa, University Science Press
QUESTIONS:
- Will a mixture containing 70% ethanol, 20% water and 10% toluene remain clear or form two layers?
From the graph plotted, the solution is appeared clear and formed one liquid layer at those concentrations
- What will happen if you dilute 1 part of the mixture with 4 parts of (a) water; (b) toluene; (c) ethanol?
1 part x 70% ethanol = 1 part x 70/100 = 0.7 part of ethanol
1 part x 20% water = 1 part x 20/100 = 0.2 part of water
1 part x 10% toluene = 1 part x 10/100 = 0.1 part of toluene
There are 0.7 part of ethanol; 0.2 part of water; 0.1 part of toluene in the mixture.
(a) 1 part of mixture + 4 parts of water:
Ethanol = (0.7/1+4) x 100% =14%
Water = (0.2+4 / 1+4) x 100% = 84%
Toluene = (0.1 /1+4) x 100% =2%
From the phase diagram, this mixture is outside the area of the binodal curve.
Therefore, a clear single liquid phase of solution is formed.
(b) 1 part of mixture + 4 parts of toluene
Ethanol = (0.7 / 1+4) x 100% =14%
Water = (0.2 / 1+4)x 100% = 4%
Toluene = (0.1+4 / 1+4) x 100% =82%
From the phase diagram, this mixture is within the area of the binodal curve.
Therefore, a two liquid phase will form and the mixture is cloudy.
(c) 1 part of mixture + 4 parts of ethanol
Ethanol = (0.7+4 / 1+4) x 100% =94%
Water = (0.2/ 1+4)x 100% = 4%
Toluene = (0.1 / 1+4) x 100% =2%
From the phase diagram, this mixture is outside the area of the binodal curve.
Therefore, a clear single liquid phase of solution is formed
Pictures:


